
Mary Acheampong
I'm a Statistician and Data Scientist
About

Statistician & Data Scientist.
Welcome to My Data Science Portfolio!
I am deeply passionate about leveraging statistical methods and data-driven technologies to solve real-world problems.
My expertise lies in transforming complex datasets into actionable insights, enabling informed decision-making and driving meaningful outcomes. Through this portfolio, I aim to showcase my skills, projects, and contributions in the fields of data science, machine learning, and statistical analysis.
Tools and Skills
Resume
Sumary
Mary Acheampong
- Laramie, Wyoming
- macheamp@uwyo.edu
Education
MSc. Statistics
2024 - 2026
University of Wyoming
BSc. Statistics
2019 - 2023
Kwame Nkrumah University of Science and Technology (KNUST)
Research and Projects
Bayesian Survival Models for Noncommunicable Disease
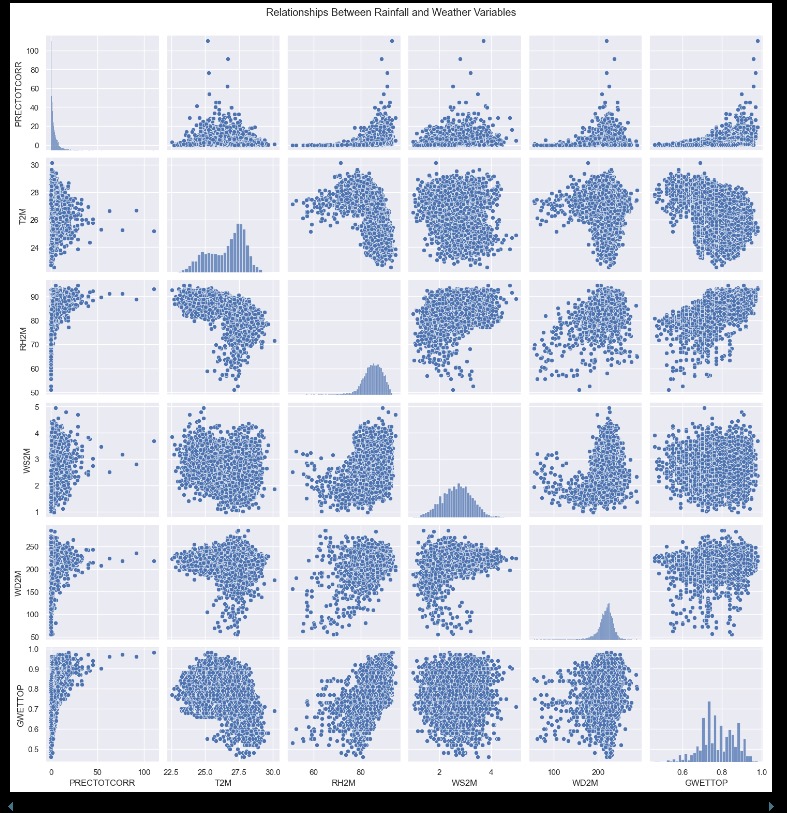
Machine Learning for Weather Forecasting – Developed and validated predictive models.
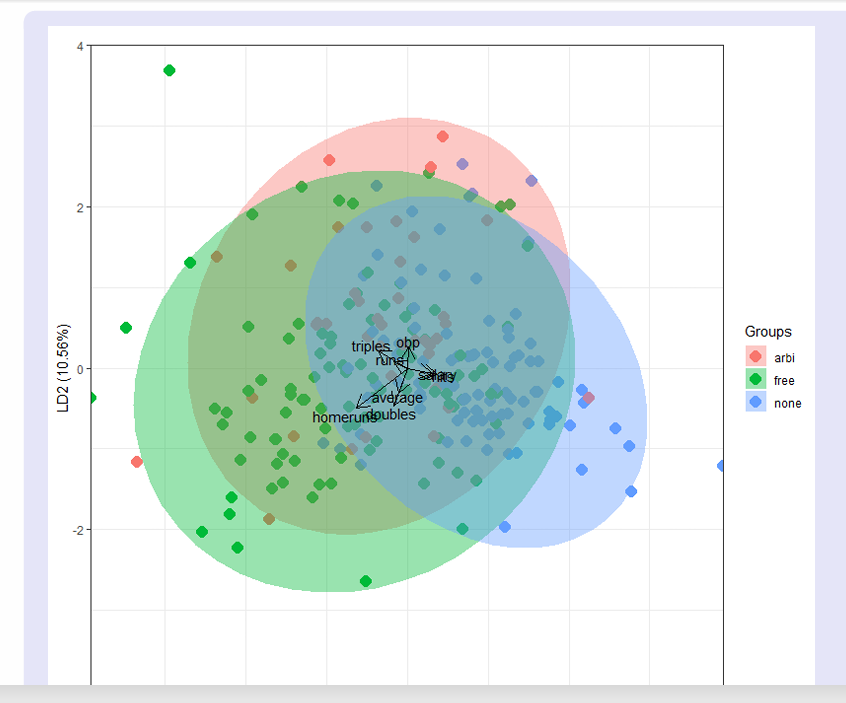
Classification of Football Players’ Status Using Linear Discriminant Analysis (LDA).
Time Series Analysis on Weather Data – Performed trend analysis, forecasting, and anomaly detection.
Multivariate Analysis on Exclusive Infant Breastfeeding Formula.
Certifications
IBM Data Science Professinal Certificate
IBM Databases and SQL for Data Science with Python
IBM Machine Learning with Python (with Honors)
Generative AI: Elevate Your Data Science Career
Python for Data Science, AI & Development
Professional Experience
Graduate Teaching Assistant
Aug 2024 - Present
University of Wyoming Dept. of Statistics and Mathematics
- Supports students in mastering statistical concepts, including probability theory, hypothesis testing, and data analysis techniques.
- Facilitates lab sessions, guiding students in using statistical tools like R and Python for data analysis and visualization.
- Provide individualized tutoring to address learning gaps and improve academic performance.
Research & Teaching Assistant
Sept 2023 - July 2024
Kwame Nkrumah University of Science and Technology (KNUST)
- Supervised undergraduate research projects and organized statistical workshops.
- Facilitated lab sessions using R and Python for data analysis and visualization.
- Collaborated with faculty to improve teaching materials for statistics courses.
Monitoring & Evaluating Officer- Intern
Sept 2022 - Dec 2022
Youth Employment Agency, Accra
- Analyzed program performance data, identifying trends to improve youth employment initiatives.
- Prepared concise, actionable reports that directly influenced policy decisions
- Developed user-friendly data collection tools to ensure accurate and reliable information gathering.
Data Analyst- Intern
Dec 2020
Forage Boston Consulting Group, USA
- Organized and managed large business datasets, ensuring data accuracy and consistency
- Created detailed dashboards and reports using Tableau and Power BI to inform client strategies.
- Conducted exploratory data analysis to uncover trends and actionable insights.
Portfolio
Experienced in managing datasets, building machine learning models, and performing insightful analysis.
- All
- Statistical Research
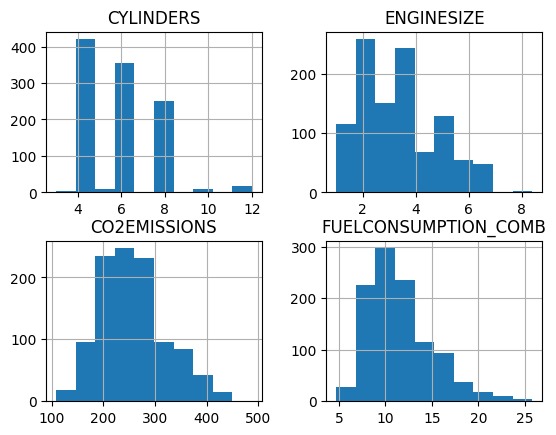
The bar plot shows that most vehicles have 4, 6, or 8 cylinders, with larger cylinder counts (10 or 12) being rare. Engine sizes are concentrated between 2.0 and 6.0 liters, peaking around 3.0 liters, indicating a right-skewed distribution with few large engines. CO2 emissions are approximately normally distributed, centered around 200-300 g/km, with high emissions above 400 g/km being uncommon. Fuel consumption (combined) is unimodal, with most values ranging from 8 to 15 L/100 km, while higher consumption (>20 L/100 km) is infrequent. Overall, the data suggests that the majority of vehicles are mid-range in terms of engine size, fuel efficiency, and emissions.
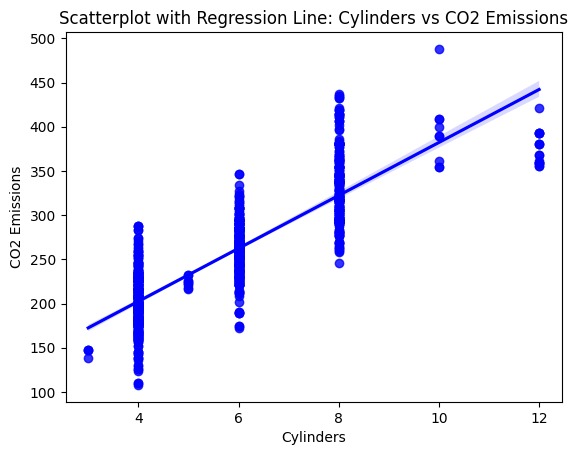
The scatterplot with the regression line shows a positive linear relationship between the number of cylinders and CO2 emissions. As the number of cylinders increases, CO2 emissions tend to rise, indicating that vehicles with more cylinders generally produce higher emissions. The points closely follow the regression line, suggesting a strong correlation. However, there is some spread at higher cylinder counts, particularly at 10 and 12 cylinders, indicating slight variability in emissions for larger engines.